El auge de los sitios web sobre la vuelta al cole y los datos que la mayoría de los distritos pasan por alto
Cada año, el ritmo del tráfico de los sitios web de K-12 cuenta la misma historia.
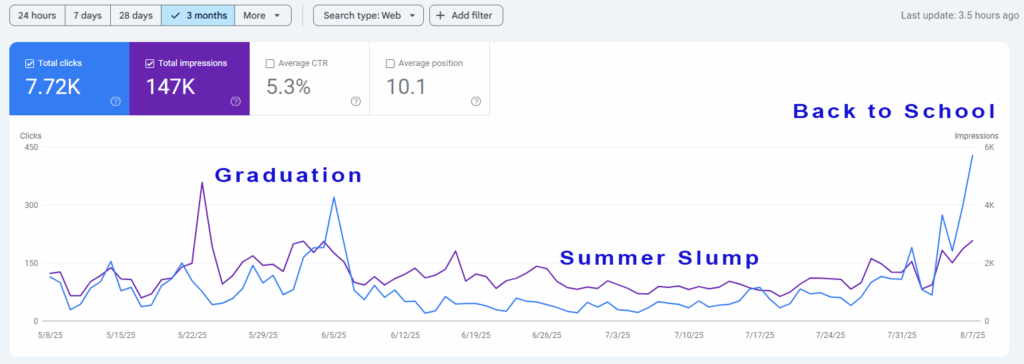
Desde principios de junio hasta mediados de julio, la tranquilidad es notable. Los padres están de vacaciones, los alumnos desconectados e incluso el personal da un paso atrás. El tráfico se ralentiza: los clics disminuyen, las impresiones se aplanan y la puerta digital del distrito está prácticamente inactiva.
Luego, a finales de julio, el cambio es repentino e inconfundible. Este año, en unos pocos días, los clics diarios han pasado de menos de 100 a más de 400. Las impresiones han aumentado de menos de 2.000 diarias a casi 6.000. Las impresiones pasaron de menos de 2.000 al día a casi 6.000. Es decir, entre cuatro y cinco veces más. Es un aumento de cuatro a cinco veces, casi de la noche a la mañana.
¿Quién está detrás del pico? Familias que comprueban las listas de materiales y los calendarios. Los alumnos buscan horarios y tareas. Los profesores y el personal confirman las actualizaciones. La prensa local busca cambios en el presupuesto y nuevos programas. Miembros de la comunidad curiosos por saber qué les espera este año.
Y, sin embargo, en muchos distritos nadie controla ni interpreta activamente estos datos. A veces se debe a que es difícil acceder a los informes. A veces, no se ha asignado a nadie su responsabilidad. Y, a menudo, es porque nadie tiene los conocimientos necesarios para generar los informes correctos o la experiencia para trabajar con Google Analytics o los paneles de control de los servidores de manera que se extraiga información realmente útil.
No se trata sólo de ver números en una pantalla, sino de saber qué métricas importan, cómo filtrar y segmentar los datos y cómo relacionarlos con preguntas reales:
- ¿Qué buscan nuestras familias?
- ¿Dónde se atascan?
- ¿Qué programas o iniciativas llaman la atención o se pasan por alto?
Este nivel de análisis convierte el tráfico bruto en información práctica sobre la interacción de su comunidad con sus activos digitales.
En este momento, su sitio web le está diciendo exactamente lo que su comunidad quiere saber, dónde se atascan y qué información no pueden encontrar. Si nadie está prestando atención, su distrito está conduciendo a ciegas durante la ventana de participación en línea más concurrida y crítica del año.
La cuestión no es si el aumento se está produciendo, los datos demuestran que sí. La cuestión es: ¿quién presta atención en su distrito?
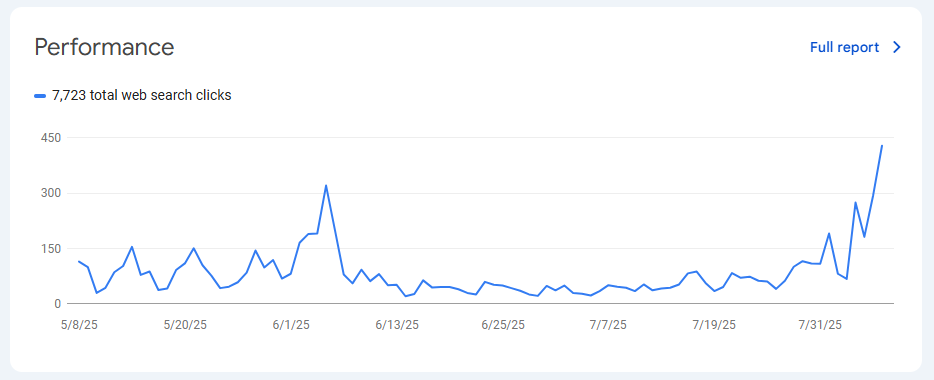
Tráfico de búsqueda, verano de 2025 en la página web de un instituto del valle central de California.

Clics e impresiones totales, verano de 2025 en el sitio web de un instituto del valle central de California.
Si desea ver qué aspecto tiene este aumento en su propio sitio web y qué revela exactamente sobre las necesidades de su comunidad, podemos realizar un análisis rápido y sin compromiso. Es sencillo, rápido y puede que le muestre cosas que no sabía que estaban ocurriendo en su sitio web en este momento.